The Chain Has Many Links
People who have not worked in offshore inspection sometimes assume that the expensive, technically demanding part of an inspection project is the survey itself: the vessel, the ROV, the time at sea. The post-survey documentation phase gets treated as administrative follow-through. This framing gets the cost distribution backwards in most programmes we have encountered through our early-access work.
The survey phase is operationally demanding, but it is time-bounded by the vessel schedule and the asset access window. The documentation phase, by contrast, is typically unconstrained in duration, performed by expensive engineering staff, and completed under conditions that are not particularly well-suited to sustained careful work. Understanding where the bottlenecks are requires mapping the whole chain.
Phase 1: Footage Capture at Sea
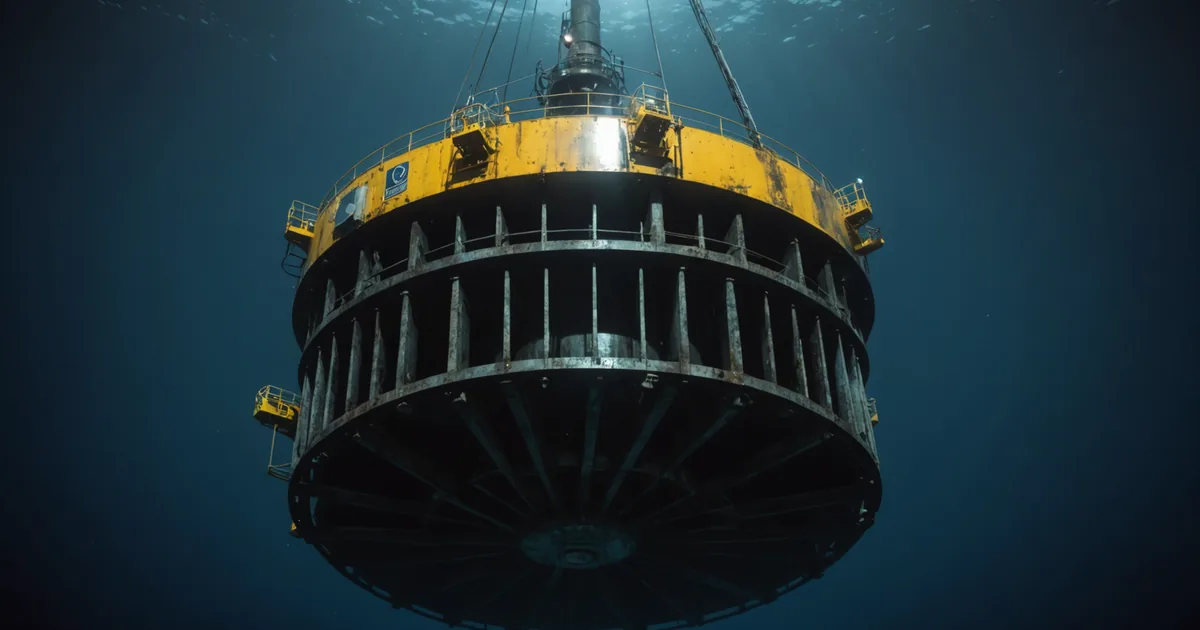
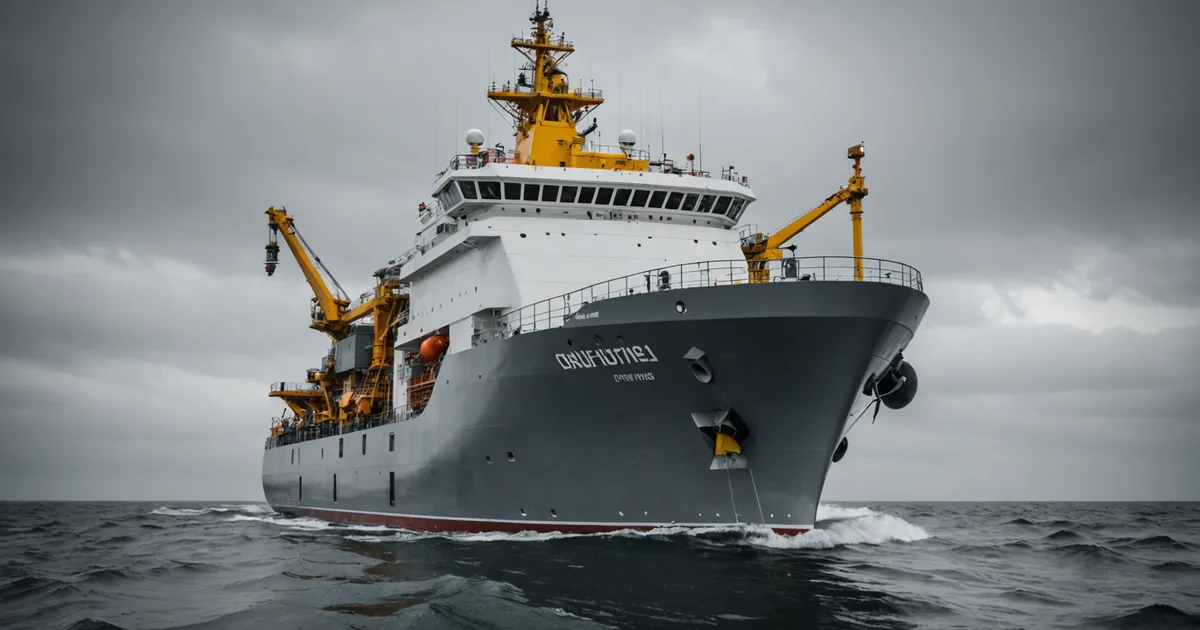
ROV inspection footage is captured by the survey operator during the vessel campaign. A typical North Sea foundation inspection programme covers between 20 and 40 monopile or jacket foundations in a single mobilisation. Each foundation generates six to ten hours of footage depending on water depth, structure complexity, and survey specification. Total footage volume for a campaign can be 150 to 350 hours.
Footage is recorded to hard drives or ruggedised storage aboard the vessel. Format varies by ROV system: some operators deliver raw H.264 video files, others deliver packaged footage with embedded telemetry overlays including GPS coordinates, depth readings, ROV heading, and umbilical length. Telemetry is important for location referencing in the final report. When it is embedded in the video file rather than captured as a separate log, it creates extraction challenges downstream.
Survey quality is constrained by conditions: visibility varies with turbidity, current, and biofouling season. A well-executed survey creates consistent lighting coverage of the structure surfaces. A survey conducted in poor visibility produces footage where significant portions of the structure are documented only partially. This limits what can be detected in review, regardless of whether that review is manual or automated.
Phase 2: Data Transfer and Ingest
When the vessel returns to port, the footage must be transferred to the review team. For operators working from a UK base, this typically means physical drive transfer or large-file upload over a managed connection. Transfer times for a full campaign are measured in hours at best; for teams working from shore-based offices with standard internet connectivity, uploading several terabytes of raw video is a non-trivial step. We have seen programmes where footage sits on drives for a week post-vessel simply waiting for connectivity bandwidth.
Once transferred, footage needs to be ingested into whatever review environment the inspection team uses. At many smaller operators, this is still a folder structure on a shared drive. Larger operators may use dedicated inspection data management systems. Neither approach is particularly fast at the ingest step, and neither provides automated quality checking of the footage before review begins. An engineer discovering that two hours of footage for a specific foundation zone are unusable due to lighting failure typically discovers this at the review stage, not at ingest.
Phase 3: Video Review and Anomaly Logging
Manual video review is the step that consumes the most engineering time in the documentation chain. A qualified inspection engineer watches the footage, logs each anomaly they identify, and captures frame references. The pace of manual review is constrained by the footage itself: most reviewers operate at 1x to 2x speed for sections requiring attention. For a 300-hour campaign, that represents a substantial commitment of engineering days even before any reporting work begins.
Anomaly logs from manual review are typically produced in spreadsheet form: foundation ID, zone code, defect type, severity assessment, frame reference, any notes. The quality and structure of this log depends heavily on the reviewing engineer's individual practice. Two engineers reviewing the same footage may produce logs with different granularity, different classification vocabulary, and different thresholds for what counts as a recordable finding.
This inconsistency is not negligence. It is the natural result of applying an inherently variable human judgment process to a task that requires consistent categorical output for downstream reporting. The log is the input to the report. Variable input quality means variable report assembly effort.
Phase 4: Report Assembly and Review
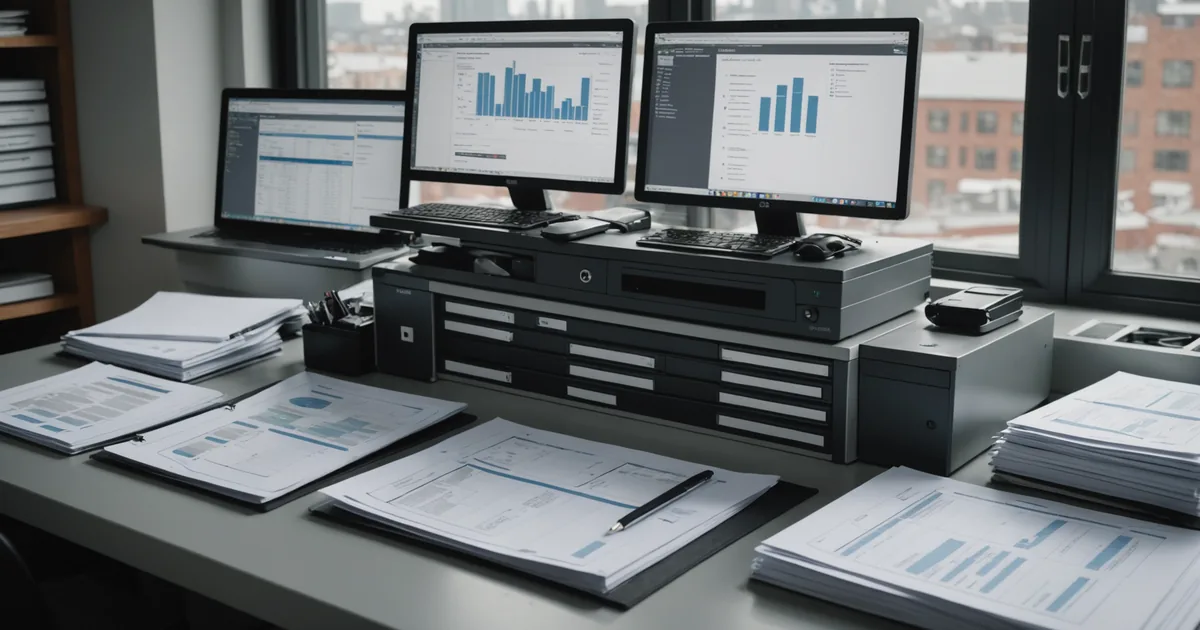
Report assembly takes the anomaly log and converts it into a structured inspection document appropriate for the relevant compliance submission. In the UK offshore sector, this typically means structuring findings for MCA or HSE Offshore Division records, with additional OSPAR documentation requirements for operators with North Sea decommissioning or maintenance obligations.
The assembly step involves: organising anomaly records by foundation and zone, applying condition rating codes from the relevant guidance (such as the International Marine Contractors Association standard conditions assessment framework), cross-referencing with prior inspection records where available, drafting condition summaries for each foundation, assembling the photographic evidence log, and producing the overall compliance statement.
A common pattern we observed in early-access operator programmes: report assembly takes longer than the review step itself. A diligent anomaly log from manual review might require two to three days to assemble into a full compliant report across 25 foundations. The report goes to an internal quality review before submission, sometimes requiring revisions that send the engineer back to the footage for clarification. The elapsed time from footage receipt to report delivery is typically six to twelve weeks in current industry practice. We have documented why in a separate article on reporting lag.
Where Automation Closes the Gap
Two steps in this chain are tractable for automation in ways that preserve engineering judgment where it genuinely matters.
The first is the video review step. Frame-by-frame detection from a trained computer vision model can replace the 300-hour manual playback with a structured anomaly record produced within hours of footage ingest. The detection output is not the final report: it is the structured anomaly log that an engineer would otherwise build manually. The engineer then reviews the detections, verifies the cases that matter, and applies professional judgment to borderline findings. The mechanical watching-and-logging step is removed from their workload.
The second is report assembly. When the anomaly record from detection is structured with consistent field definitions, location codes, and condition classifications from the start, the assembly step becomes substantially faster. Rather than converting a variable-quality handwritten log into report format, the engineer is reviewing a pre-structured draft and applying their professional judgment to the content. The compliance report can be drafted from detection output within the same processing window as the detection itself.
These two steps together represent roughly 70 to 80 percent of the elapsed time in the typical inspection-to-report chain. The vessel and survey phase is time-bounded and largely already optimised. The reporting bottleneck is in post-survey documentation. That is where a different approach to the workflow produces meaningful reductions in programme delivery time, and meaningful reductions in the engineering cost of documentation per asset.
The offshore wind sector is heading toward tripled installed capacity over the next decade. The inspection programmes required to maintain and certify that capacity cannot scale at the same cost ratio as manual documentation requires. The workflow needs to change at the post-survey stage. That is the problem we are building Ecodetect to address.